
On a platform our size, reliability mostly comes down to knowing what happens when something fails. We find out by making things fail on purpose, on a schedule, and writing down what happened.
Below are the drills we run, what each one has caught, and where we are taking resilience next. All the numbers come from our own logs.
No pets
Every machine in the platform can be destroyed and rebuilt from the repository. Nothing gets configured by hand and then remembered. We test that literally:
make rebuild-test # destroy a worker, recreate it, configure it, put it back in serviceThe first full run of this drill did exactly what a drill is for: it surfaced five things to harden, on a quiet afternoon rather than during an incident.
The biggest was about first contact. We lock every machine down so it is reachable only over our encrypted overlay network, and a brand-new machine isn’t on that network yet. The drill showed that a fresh machine’s very first configuration run needed its own way in, so we built one.
It also found a readiness check that assumed an existing machine: it waited for the overlay’s network interface before the software that creates that interface was installed. Harmless on a running machine, a two-minute stall on a fresh one. It now runs in the right order.
The rest were small refinements to the rebuild script itself, such as handling a remembered SSH host key and a machine learning its own overlay address mid-run.
The run that followed passed unattended, end to end. We then moved a live app onto the rebuilt machine and it served the same data as before. We repeat the drill monthly, so rebuilding a machine stays a routine operation.
The second run changes nothing
We configure machines with Ansible. A change isn’t done until two complete configuration runs across every machine have passed back to back and the second one changed nothing.
A second run that still changes something means the configuration only works once, or is fighting itself. Holding every change to this standard catches configuration that works on the first run and not the second, and service restarts that never actually fire. We check it on every change, and run a third time when we want to be sure.
Your data leaves the machine every five minutes
Each app (we call it a cell) gets a /data volume. restic backs it up to Cloudflare R2 every five minutes and again whenever the cell stops, and the cell restores from there whenever it starts somewhere new. We deliberately don’t keep backups on our own storage, because that storage sits next to the apps and would fail along with them.
We test two things. One is that restores actually work. The backup test writes data, backs it up, deletes the original, restores it, checks that it’s byte-identical, and then has restic re-read every stored block to verify it. Moving a cell from one worker to another is itself a restore from R2, so every move exercises the same path.
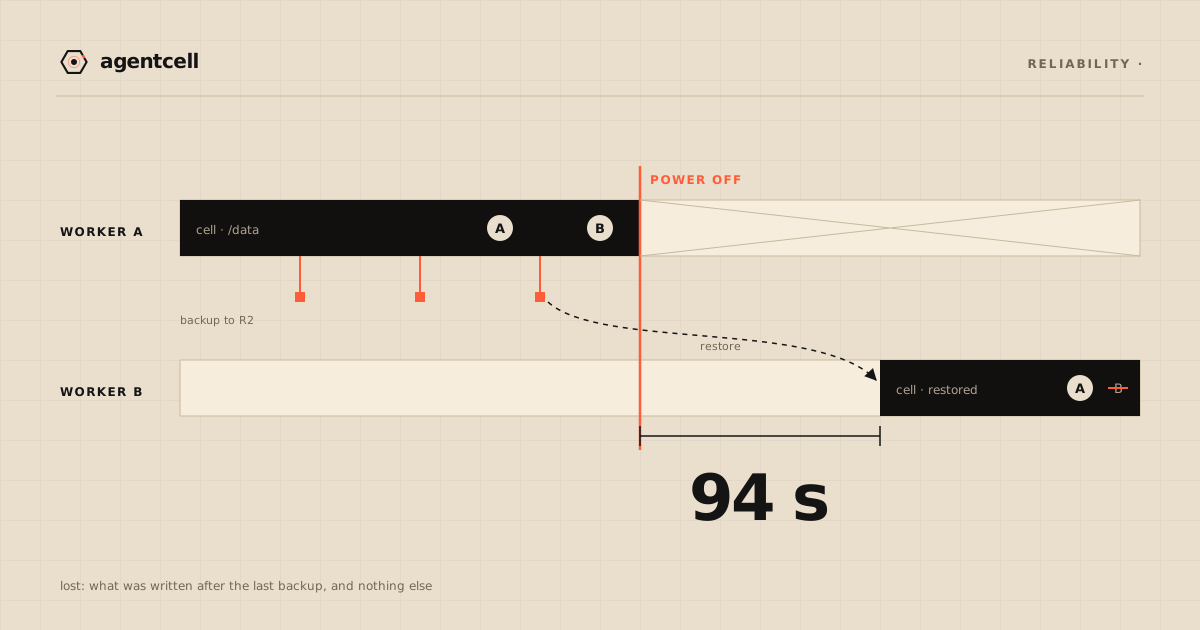
The other is how much you can lose. We measured it by writing marker A into a live cell, waiting for it to reach a backup, writing marker B, and then cutting the power to the worker, abruptly, with no clean shutdown. The cell came back on the other worker after 94 seconds, serving marker A. Marker B was gone. So the claim holds: at most, you lose what was written since the last backup, and nothing else. We refined the drill twice until it measured precisely that claim and nothing adjacent to it.
We also keep an eye on how quickly a restore can start. At one point a restore’s listing step had grown to about 700 seconds, because a stale lock was keeping retention from pruning old snapshots. Retention now runs continuously: the snapshot count went from about 7,000 to 39, and the listing takes about 6 seconds. It was fixed before any cell needed to move in a hurry.
Deleting has two levels. destroy stops an app and removes its volume but keeps its backups. purge deletes the backups too, and can’t be undone.
A safety check that needed context
Consul, our service discovery, refuses to let a server rejoin its cluster after more than seven days offline. In a multi-server cluster that’s a sensible rule: a long-absent server has a stale view and shouldn’t get a vote.
We met this rule while bringing the platform back up after a pre-launch pause. Our cluster runs a single server today, so there was no one for it to be stale against, and the check was simply keeping it from starting. The error message suggested wiping the data directory. That would have discarded the service catalogue and the access-control state to satisfy a clock comparison, so we didn’t. Nothing was lost.
Instead, the setting is relaxed only while there is exactly one server. Add a second server and the configuration drops the override by itself, which restores the safety check at exactly the point where it starts to matter.
It’s a good reminder that the fix a system suggests isn’t automatically the right fix for your situation.
A canary that signs up every day
Unit tests cover the parts. We also wanted something that covers the whole path a new customer takes, so we run a canary that behaves as a real customer, over the public internet, using the public client. Each run:
- Presents a machine credential to the human login page and expects to be refused.
- Deploys four sample apps, each of which has to serve the marker from its own build.
- Has one app write a note to its SQLite database, redeploys it, and checks that the note reads back.
- Tears everything down: apps, volumes, backups and login applications.
It runs daily on a timer, and also after any configuration change. Each check reports a gauge to our metrics, and an alert pages us if a gauge reads zero or if the canary stops reporting altogether.
The canary earned its place during commissioning. Each of its first six runs hardened something, and one of them found a product edge case that no unit test could reach: redeploying identical source straight after purging an app. Deploys are idempotent, so the second one was recognised as “unchanged” and pointed at the purged deployment. Removing an app now clears that record too, and the canary exercises the path every day.
It has also shown us how the platform behaves when the network is having a bad night. One run coincided with a slow network, and a build that normally takes a minute or two took seven. The canary allows four minutes, so it flagged the delay, which is exactly its job. We kept the threshold where it is.
That run also gave us five refinements to make the canary’s own reporting sharper. The main one: one slow deploy should be reported as one finding, not four, and teardown should wait for any deploy still in flight before it declares an app gone.
A smoke test that checks the bytes
Static sites went live on 25 September, one switch at a time. The first live run of their smoke test failed 7 of its 88 checks.
The sites were up, and in a browser they looked fine. The smoke test doesn’t look; it compares what comes back with what was published, and the two differed. Cloudflare was rewriting HTML in flight, through its email obfuscation feature, and dropping the ETag we set. Harmless-sounding, but a tenant’s page should be exactly the bytes they deployed, and an ETag that disappears breaks the browser’s cache checks.
The fix was one header. Every static response now carries Cache-Control: no-transform, which tells anything in between not to modify the body. The rerun passed 90 of 90. It’s the same lesson as the upload stall in the deploy post: the problem lived at a boundary, and only a check over the real route, reading the real bytes, could see it.
Watching the monitors
An external probe checks the public path from outside our network. Every machine also has a dead-man alert, which fires when the machine stops reporting, not only when it reports something bad.
The dead-man alerts proved themselves within five minutes of going live: they spotted three machines whose metric shipping had stalled, and all three were back to normal within half an hour.
Alerts go to Slack. We measured delivery end to end with a test rule that fires on purpose, and the page arrived in 23 seconds. We rehearse the emergency switch too: turning public traffic off took effect in 17 seconds, and turning it back on took 15.
How changes ship
When a change touches both code and the database schema, we decide the order for that change and write it down. For example: update the admission proxy, then the control plane, then apply the schema within seconds. Old code keeps working against the old schema for those few seconds, so deploys carry on throughout.
Implementation is split into small packages. Each one is built in its own isolated worktree and reviewed on its own before it merges, one at a time.
We also don’t count a check until we’ve seen it fail, and that goes for reliability checks as much as security ones. It’s the same principle behind every drill on this page.
Where we’re taking resilience next
- One region today. A regional outage would take the platform offline until the region recovers. Your data is backed up off-site to R2, so it survives either way. Running in more than one region is a later step.
- A second control-plane server. The scheduler and service discovery run as single servers. Adding a second is a known, planned step, and the Consul override above already removes itself when it happens.
- An independent database copy. Database recovery uses our managed Postgres provider’s point-in-time recovery today. An independent off-site copy is planned.
- Sharper canary reporting. The five refinements from the slow-network run are in progress. The external probe and dead-man alerts watch the running system continuously in the meantime.
When items come off this list, we’ll say so here.
This is the last post in a series on how AgentCell is built. Start from what happens when you run agentcell deploy, or deploy now.